What Changed in the Top 10 for 2021
There are three new categories, four categories with naming and scope changes, and some consolidation in the Top 10 for 2021.
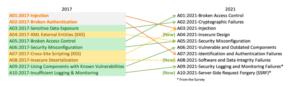
A01: 2021-Broken Access Control moves up from fifth position; 94% of the apps have been tested for some form of broken access control. The 34 CWEs mapped to Broken Access Control had more hits in apps than any other category.
A02: 2021-Cryptographic Failures moves up one position to 2nd position, formerly known as Exposure of confidential data, that it was a broad symptom, not a root cause. The renewed focus here is on encryption-related flaws, which often lead to exposure of sensitive data or system compromise.
A03: 2021-Injection slides to third position. 94% of applications have been tested for some form of injection, and the 33 CWEs mapped to this category have the second highest number of hits in applications. Cross-site Scripting is now part of this category in this issue.
A04: 2021-Unsafe design is a new category for 2021, focusing on risks related to design flaws. If we genuinely want to “go left” as an industry, it requires more use of threat modeling, sound design principles and standards, and reference architectures.
A05: 2021-Incorrect security configuration passed of # 6 in the previous edition; 90% of the applications have been tested for some kind of misconfiguration. With more changes in highly configurable software, it's not surprising to see this category rise. The former XML External Entities (XXE) category is now part of this category.
A06: 2021-Vulnerable and Outdated Components was previously titled Using components with known vulnerabilities and it's No. 2 in the industry survey, but it also had enough data to hit the top 10 through data analytics. This category moved up from 9th position in 2017 and it is a known issue that we have difficulty testing and assessing risk. It is the only category that does not have CVEs mapped to the included CWEs, so a default exploration and impact weights of 5.0 are considered in its scores.
A07: 2021-Identification and Authentication Failures previously broke authentication and it's sliding down from the second position, and now includes CWEs that are more related to misidentifications. This category is still an integral part of the Top 10, but the increased availability of standardized structures seems to be helping.
A08: 2021-Software and data integrity failures is a new category for 2021, focused on making assumptions related to software upgrades, critical data and CI/CD pipelines without checking integrity. One of the biggest weighted impacts of the CVE / CVSS data mapped to the 10 CWEs in this category. 2017's unsafe deserialization is now part of this larger category.
A09: 2021 - Security logging and monitoring failures were previously Registration and monitoring insufficient and was added from the sector survey (#3), passing from the previous #10. This category has been expanded to include more types of failures, is challenging to test and is not well represented in CVE / CVSS data. However, failures in this category can directly impact visibility, incident alerting and expertise.
A10: 2021-Server-Side Request Forgery added from industry survey (#1). The data shows a relatively low incidence rate with above-average test coverage, along with above-average ratings for exploit potential and impact. This category represents the scenario where industry professionals are telling us this is important, although it is not illustrated in the data at this time.
Methodology
This part of the Top 10 is more data-driven than ever, but not blindly data-driven. We selected eight of the ten contributed data categories and two categories from a high-level industry survey. We do this for a fundamental reason: looking at the data provided is looking back. AppSec researchers take time to find new vulnerabilities and new ways to test for them. It takes time to integrate these tests into tools and processes. By the time we can safely test a weakness at scale, it's probably already gone. To balance this view, we use an industry survey to ask people on the front lines what they see as critical weaknesses that the data may not yet show.
There are some critical changes we've adopted to continue to mature into the Top 10.
How categories are structured
Some categories have changed from the previous edition of the OWASP Top Ten. Here's a high-level summary of category changes.
Previous data collection efforts have focused on a prescribed subset of approximately 30 CWEs with one field requesting additional findings. We learned that organizations would primarily focus on these 30 CWEs and would rarely add other CWEs they saw. In this iteration, we open it and just ask for the data, with no CWE restriction. We ask for the number of apps tested for a given year (starting in 2017) and the number of apps with at least one instance of a CWE found in testing. This format allows us to track the prevalence of each CWE in the app population. We ignore frequency for our purposes; although it may be necessary for other situations, it only hides the actual prevalence in the application population. Whether an application has four instances of a CWE or 4,000 instances is not part of the calculation for the top 10. We went from approximately 30 CWEs to nearly 400 CWEs to analyze in the dataset. We plan to do additional data analysis as a supplement in the future. This significant increase in the number of CWEs requires changes in the way categories are structured.
We spent several months grouping and categorizing the CWEs and could have continued for months more. We had to stop at some point. They exist root causes and types of symptom of CWEs, in that the types of root cause are like "Cryptographic Fault" and "Misconfiguration" in contrast to types of symptom such as “Confidential Data Exposure” and “Denial of Service”. We decided to focus on the root cause whenever possible as it is more logical to provide identification and correction guidance. Focusing on the root cause over the symptom is not a new concept; the Top Ten has been a mix of symptom and root cause . ; we're just being more deliberate about it and calling on it. There is an average of 19.6 CWEs per category in this installment, with lower limits of 1 CWE for A10: 2021-Server-Side Request Forgery (SSRF) to 40 CWEs in A04: 2021-Unsafe design . This updated category structure offers additional training benefits as companies can focus on CWEs that make sense for a language/structure.
How data is used to select categories
In 2017, we selected categories by incidence rate to determine probability and then ranked them by team discussion based on decades of experience in Exploitability, Detectability (also probability), and Technical Impact. For 2021, we want to use data for exploitability and impact if possible.
We downloaded the OWASP Dependency Check and extracted the CVSS Exploit and impact scores grouped by related CWEs. It took a bit of research and effort as all CVEs have CVSSv2 scores, but there are flaws in CVSSv2 that CVSSv3 must fix. After a certain time, all CVEs also receive a CVSSv3 score. Additionally, scoring ranges and formulas have been updated between CVSSv2 and CVSSv3.
In CVSSv2, both Exploit and Impact could be up to 10.0, but the formula would drop them to 60% for Exploit and 40% for Impact. In CVSSv3, the theoretical maximum was limited to 6.0 for Exploit and 4.0 for impact. With the weighting considered, the impact score increased, almost a point and a half on average on CVSSv3, and the exploitability dropped by almost half a point below on average.
There are 125k records from a CVE mapped to a CWE in the NVD data extracted from the OWASP dependency check, and there are 241 unique CWEs mapped to a CVE. 62k CWE maps have a CVSSv3 score, which is approximately half the population in the dataset.
For the top ten, we calculated average exploration and impact scores as follows. We grouped all CVEs with CVSS scores by CWE and weighted exploration and impact scored by the percentage of population that had CVSSv3 + the remaining population of CVSSv2 scores to obtain an overall average. We map these averages to the CWEs in the dataset to use as the Exploitation and Impact score for the other half of the risk equation.
Why not just pure statistical data?
The results in the data are mainly limited to what we can test in an automated way. Talk to an experienced AppSec professional, and they'll tell you about things they've found and trends they've seen that haven't yet been in the data. It takes time for people to develop testing methodologies for certain types of vulnerability and longer for those tests to be automated and run on a large population of applications. Everything we find is a lookback and may be missing trends from the past year that aren't present in the data.
Therefore, we chose only eight of the ten data categories because they are incomplete. The other two categories are from industry research. It allows professionals on the front lines to vote on what they see as the biggest risks that may not be in the data (and may never be expressed in the data).
Why incidence rate instead of frequency?
There are three main sources of data. We have identified them as Human Assisted Tools (HaT), Human Assisted Tools (TaH) and Raw Tools.
Tooling and HaT are high frequency location generators. The tools will look for specific vulnerabilities and will relentlessly try to find all instances of that vulnerability and will generate high discovery counts for some vulnerability types. Look at Cross-Site Scripting, which is usually one of two flavors: it's a minor, isolated error or a systemic problem. When it's a systemic issue, the discovery count can run into the thousands for an application. This high frequency drowns out most other vulnerabilities found in reports or data.
TaH, on the other hand, will encounter a broader range of vulnerability types, but at a much lower frequency due to time constraints. When humans test an application and see something like Cross-Site Scripting, they usually find three or four instances and stop. They can determine a systemic finding and write it down with a recommendation to fix on an application scale. There is no need (or time) to find all instances.
Suppose we take these two distinct datasets and try to merge them in frequency. In that case, Tooling and HaT data will drown out the more accurate (but broad) TaH data and it's a good part of why something like Cross-Site Scripting ranks so highly on many lists when the impact is generally low to moderate. It's because of the sheer volume of discoveries. (Cross-Site Scripting is also reasonably easy to test, so there are many other tests for it too).
In 2017, we introduced the use of incidence rate to take a new look at the data and merge Tooling and HaT data with TaH data. The incidence rate asks what percentage of the application population had at least one instance of a vulnerability type. We don't care if it was punctual or systemic. This is irrelevant for our purposes; we just need to know how many apps had at least one instance, which helps provide a clearer view of test results across multiple test types, without drowning the data in high-frequency results.
What is your data collection and analysis process?
We formalized the OWASP Top 10 data collection process at the Open Security Summit in 2017. OWASP Top 10 leaders and the community spent two days working on formalizing a transparent data collection process. The 2021 edition is the second time we have used this methodology.
We publish a call for data through the social media channels available to us, the project and OWASP. At OWASP Project page , we list the data elements and structure we are looking for and how to submit them. At the GitHub project , we have example files that serve as templates. We work with organizations as needed to help uncover the structure and mapping for CWEs.
We get data from organizations that are testing vendors by commerce, bug reward vendors, and organizations that contribute internal testing data. Once we have the data, we load it together and run a fundamental analysis of what the CWEs map to risk categories. There is overlap between some CWEs and others are closely related (eg cryptographic vulnerabilities). Any decisions regarding the raw data submitted are documented and published to be open and transparent with how we normalize the data.
We look at the eight categories with the highest incidence rates for inclusion in the Top 10. We also look at industry survey results to see which ones might already be in the data. The first two votes that are not yet present in the data will be selected for the other two places in the Top 10. Once all ten are selected, we apply generalized factors for exploitability and impact; to help sort the top 10 in order.
data factors
There are data factors listed for each of the top 10 categories, here's what they mean:
- Mapped CWEs : The number of CWEs mapped to a category by the Top 10 team.
- Incidence rate : The incidence rate is the percentage of apps vulnerable to that CWE out of the population tested by that organization that year.
- (Test) Roof : The percentage of applications tested by all organizations for a given CWE.
- Weighted Exploit : The Exploit sub-score of CVSSv2 and CVSSv3 scores assigned to CVEs mapped to CWEs, normalized and scaled to a 10pt scale.
- Weighted impact : The impact sub-score of CVSSv2 and CVSSv3 scores assigned to CVEs mapped to CWEs, normalized and placed on a 10pt scale.
- Total occurrences : Total number of apps found with CWEs mapped to a category.
- Total CVEs : total number of CVEs in the NVD database that were mapped to the CWEs mapped to a category.
2017 Category Relationships
There has been a lot of talk about the overlap between the Top Ten Risks. By definition of each (list of CWEs included), there really isn't any overlap. However, conceptually there may be overlap or interactions based on top-level nomenclature. Venn diagrams are often used to show overlays like this.
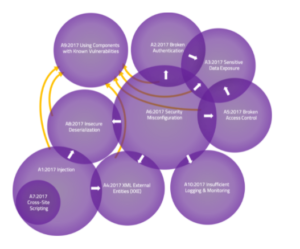
The Venn diagram above represents the interactions between the top ten risk categories for 2017. In doing so, some key points became obvious:
- It can be argued that Cross-Site Scripting ultimately belongs to Injection as it is essentially Content Injection. Looking at the 2021 data, it became even more evident that XSS needed to move to injection.
- Overlap is in one direction only. Often, we will classify a vulnerability by its ultimate manifestation or “symptom,” not its (potentially profound) root cause. For example, “Exposition of sensitive data” may have been the result of an “incorrect security configuration”; however, you will not see it in the other direction. As a result, arrows are drawn on the interaction zones to indicate in which direction it occurs.
- Sometimes these diagrams are drawn with everything in A06: 2021 Using components with known vulnerabilities . While some of these risk categories may be the root cause of third-party vulnerabilities, they are often managed differently and with different responsibilities. The other types usually pose primary risks.
Source: https://owasp.org/Top10/?utm_campaign=20210914_g-hash_-_ed_080&utm_medium=email&utm_source=RD+Station
THE SAFEWAY is an Information Security company, recognized by its clients for offering high added value solutions, through Information Security projects that fully meet the needs of the business.
During these years of experience, we have proudly accumulated several successful projects that have earned us credibility and prominence in our clients, which constitute in large part the 100 largest companies in Brazil.
Today through more than 23 strategic partnerships with global manufacturers and our SOC, SAFEWAY is considered a one stop shopping with the best technology solutions, processes and people.
SAFEWAY can help your organization through SAFEWAY SECURITY TOWER a complete service chain so that your operations continue to be monitored and protected by a highly specialized team. Our SOC works on a 24×7 basis, with a high-performance technical team and tools to assist your organization in identifying and responding to incidents in a predictive and reactive manner, keeping your business safe and monitored at all times.
Let's make the world a safer place to live and do business!