The annual report Imperva Incapsula Bot Traffic, now in its fifth year, is a continuous statistical study of bot. In this latest report, over 16.7 billion visits to 100,000 randomly selected domains in the Incapsula network were examined to address the following issues:
- How much website traffic is generated by bots?
- How are bad robots used in cyber attacks?
- What drives good bot visits to various websites and services?
- What are the worst and best robots?
The answers to these questions are found in the infographic below. In the accompanying commentary, we take a closer look at some of the macro trends, as reflected in the activity of the most active bot archetypes.
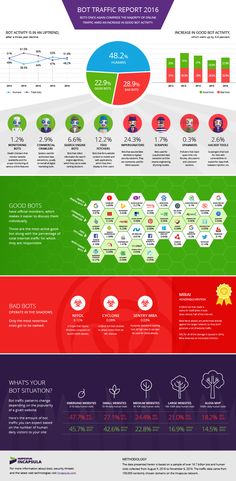
Open the infographic here: Botnet Report 2016
Source: Incapsula Imperva